Thu Oct 4 21:50:29 PDT 2012
Revisiting Google's Growth
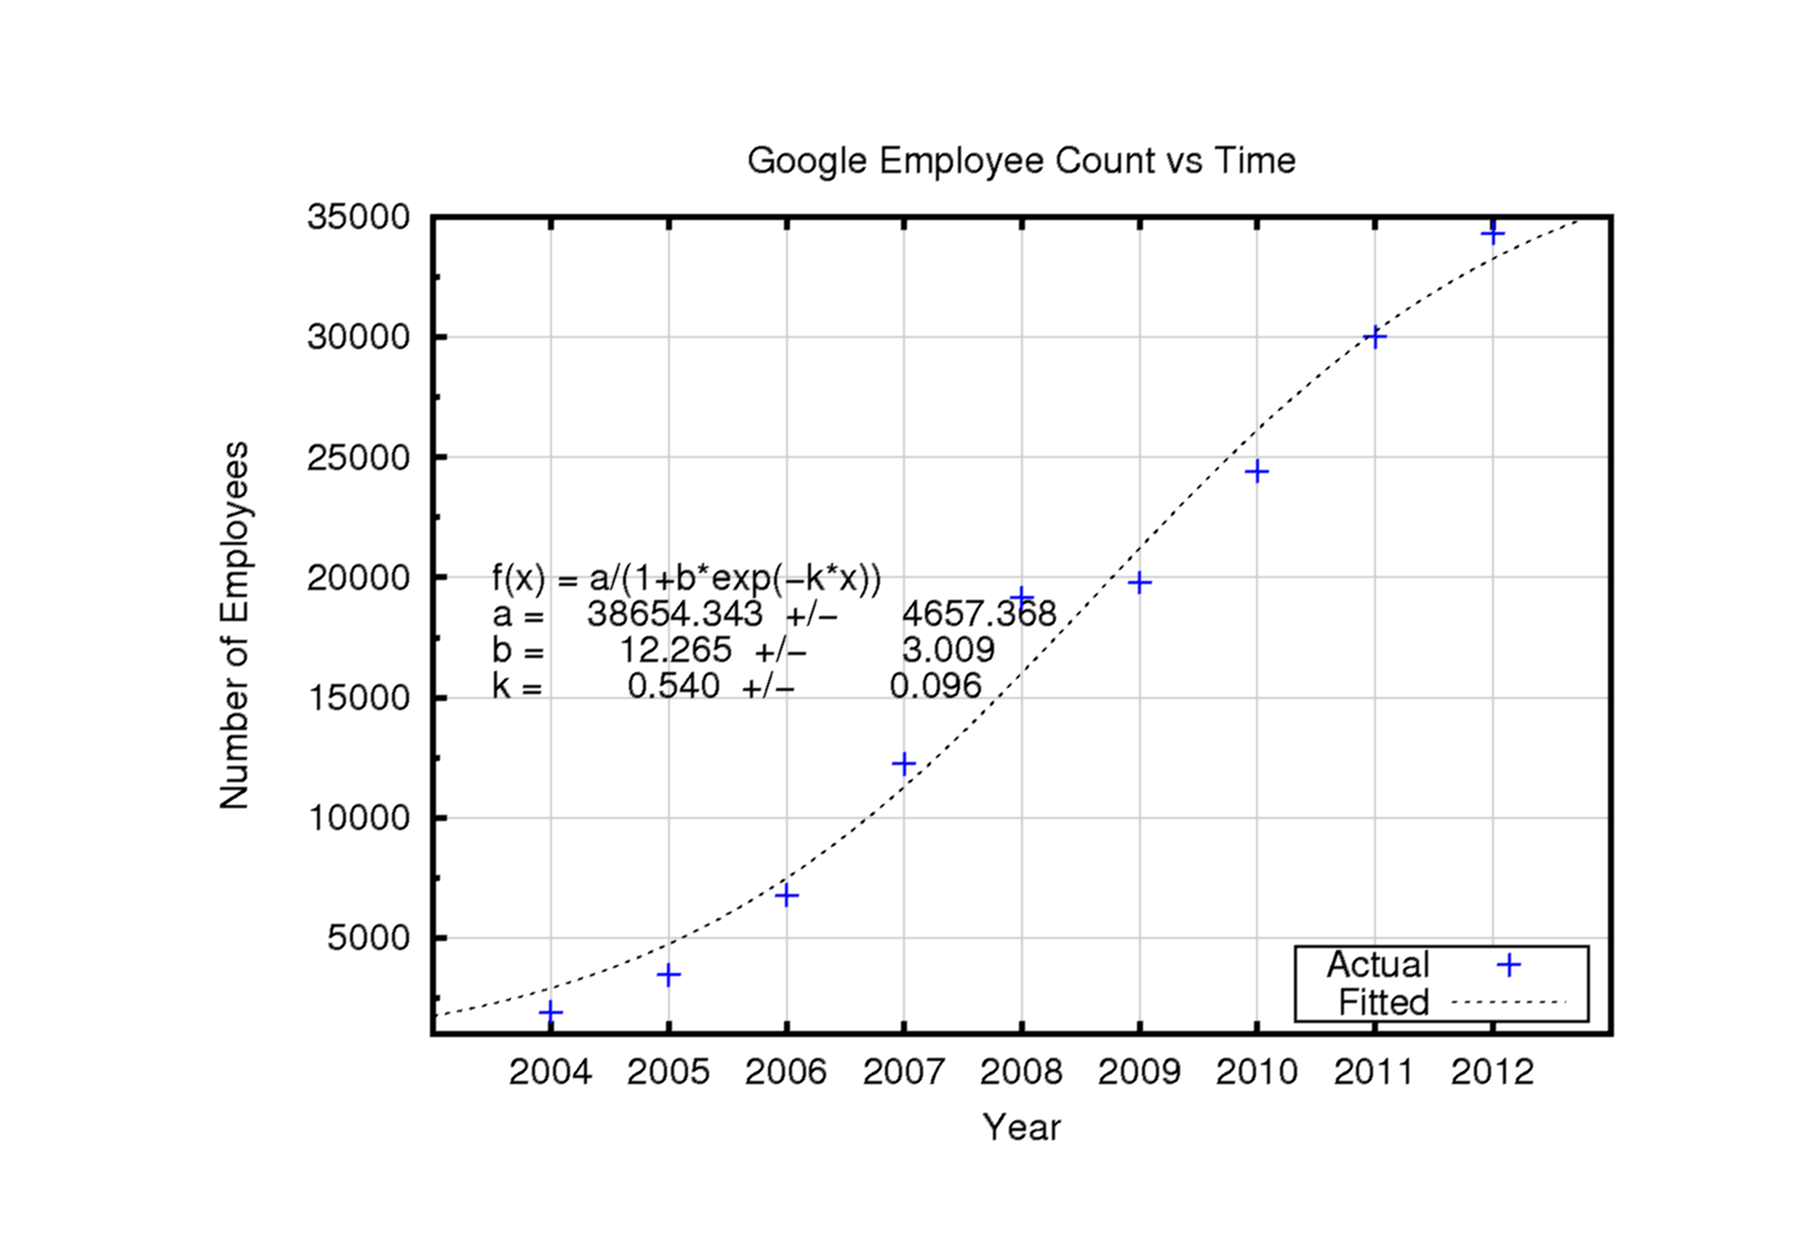
A while back, I investigated the growth of companies like Google and Yahoo, looking at their employee growth versus time. Well, I revisited this recently, and as a few years have passed there is more information to plot!
The image below shows the number of employees at Google versus time. The fit to a logistics function is still quite good! Google has been amusing itself buying companies in areas unrelated to 'normal' Google core areas, so I don't think it will be possible to continue to do this analysis. But if it were, the logistics fit indicates that Google's growth is beginning to slow.

I made this plot using gnuplot. I'll post the script in a future post. I find quasi-technical analyses like this much more straightforward using a command line + data file approach. If I want to replot the information some time after the original work with a new data point (as in this case), I can simply rerun the necessary command (conveniently saved in ascii) and recreat the hard copy. The same operation with Excel or OpenOffice requires multiple mouse clicks and rarely yields the same output without laborious reformatting. And, of course, simple ascii commands and raw data files can be saved in source repositories like cvs or svn for controlled, reproducible, ongoing work.
So it is clearly better to work like this. But, of course, everyone in the world prefers to use Excel and OpenOffice!